openFoam并行计算的计算效率如何提升
-
最近在用自己编的求解器运行计算一个300万网格的算例,想请假下怎么从编程的角度提升计算效率,又相关的教程么~
我在网上看到有大佬针对输出显示的优化的介绍:https://www.topcfd.cn/18658/
除了这种还有别的可以参考的么,非常感谢~ -
可以使用profiling tool 去查程序的某个部分有问题。
简单的intel vtune, intel advisor。
这个需要你有一些基础的performance engineering的知识。
可以在网上找找关键词,MPI tracer, roofline model, performance engineering。这还涉及到MPI的知识。可以找一下关于MPI的课,不过MPI在OF中基本被各种隐藏,一般情况下可能你也看不到什么。不过我记得有关于mesh的renumbering的操作,在大规模并行的时候,会有一些优化。 当然这个也要看你使用的是什么计算,网格怎么分配的~
-
用OpenFOAM内置的吧。最近的WM_COMPILE_OPTION除了opt,debug模式外,还有一个Prof模式。这个Prof使用开源的gprof做的。效果还是可以的。使用教程见:
https://meywang.wordpress.com/2011/07/29/openfoam-profiling/1- Add an environmental variable in the .bashrc (or .cshrc) file: export WM_COMPILE_OPTION=Prof 2- Source the .bashrc file and recompile the OpenFOAM. 3- Then, you will find a new command -pg is using during the compiling. (Of course, you can just add -pg in the files and options files of the solvers, and step1 is not needed now.) 4- Run the solver you want and a gmon.out file will be created in the case dir. 5- Use $gprof -b solvername(absolute path is needed) and you will get the sampling data. 6- One can also use kprof to analyse the sampling data.效果会像下面一样(随便测的,执行时间太快了不会被统计到)
Each sample counts as 0.01 seconds.
  %   cumulative   self              self     total
 time   seconds   seconds    calls  us/call  us/call  name
100.00      0.01     0.01     1401     7.14     7.14  Foam::List<double>::List(Foam::List<double> const&)
  0.00      0.01     0.00    14376     0.00     0.00  Foam::word::stripInvalid()
  0.00      0.01     0.00     9305     0.00     0.00  Foam::List<double>::List(int)
  0.00      0.01     0.00     7812     0.00     0.00  Foam::fvsPatchField<double>::New(Foam::word const&, Foam::word const&, Foam::fvPatch const&, Foam::DimensionedField<double, Foam::surfaceMesh> const&)
还有些可视化的方法可见:
https://codeyarns.com/tech/2013-06-24-how-to-visualize-profiler-output-as-graph-using-gprof2dot.html#gsc.tab=0效果见:
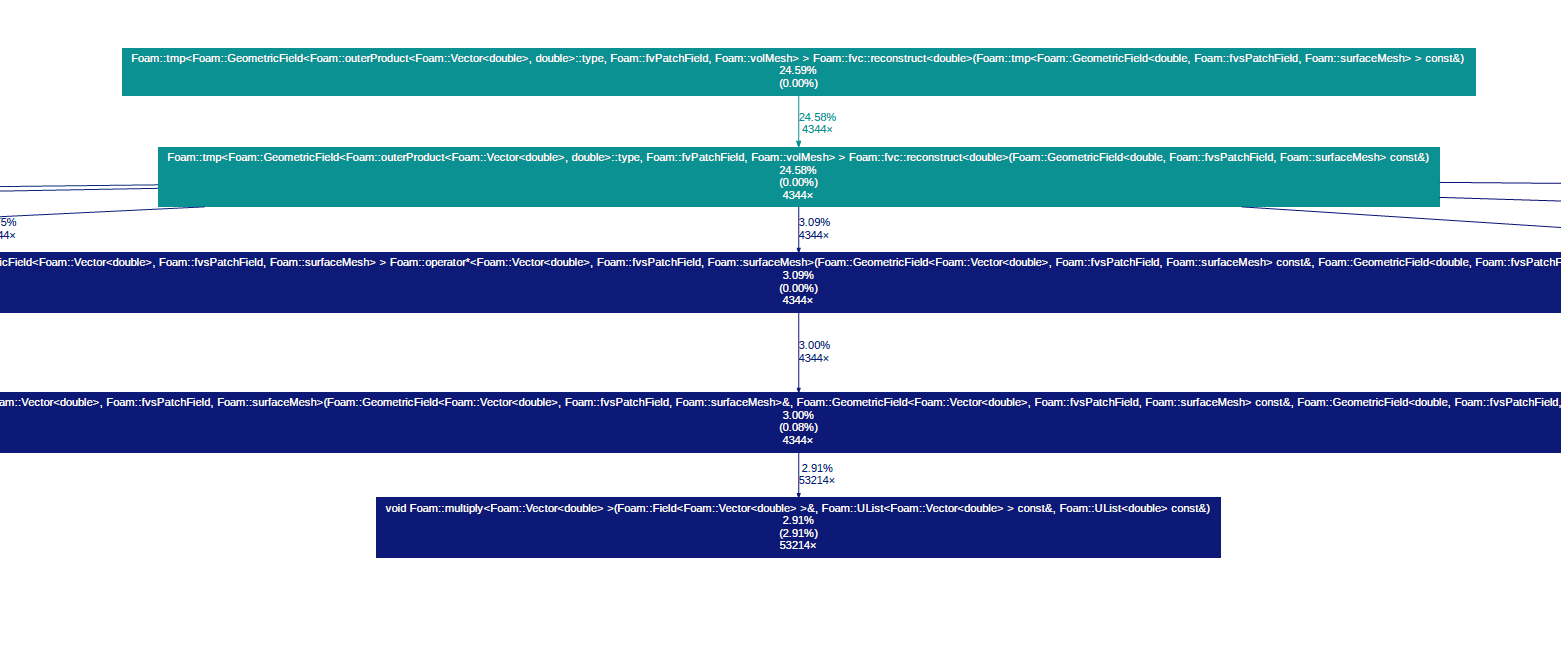
有个问题就是OpenFOAM的命名空间作用域太长了,生成的这种结构图肥肠不好看。暂时不知道怎么解决
