Navigation

    CFD中文网

    CFD中文网

    • Login
    • Search
    • 最新

    请问pyFoam中plot的bounded variables代表的是什么意思?

    OpenFOAM
    2
    3
    1671
    Loading More Posts
    • Oldest to Newest
    • Newest to Oldest
    • Most Votes
    Reply
    • Reply as topic
    Log in to reply
    This topic has been deleted. Only users with topic management privileges can see it.
    • yhdthu
      yhdthu 讲师 last edited by

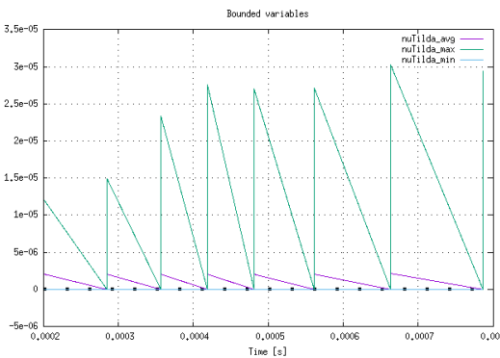
      如图,在计算的时有时会蹦出这个plot图,我用的是des类湍流模型,这个代表啥意思?为什么呈现这种趋势呢?这个有没有什么问题呢?

      0_1507998802794_test.png

      长风破浪会有时,直挂云帆济沧海

      1 Reply Last reply Reply Quote
      • 李东岳
        李东岳 管理员 last edited by

        没用过pyFoam,这个是用来花残差的?看看log也是变化的?

        CFD高性能服务器 http://dyfluid.com/servers.html

        yhdthu 1 Reply Last reply Reply Quote
        • yhdthu
          yhdthu 讲师 @李东岳 last edited by

          @李东岳 前辈,我一直用pyFoam来观察残差,我猜的这个bounded variable plot出现是因为计算出现了不稳定,如果这个bounded量计算没过界就不会出现。:confused:

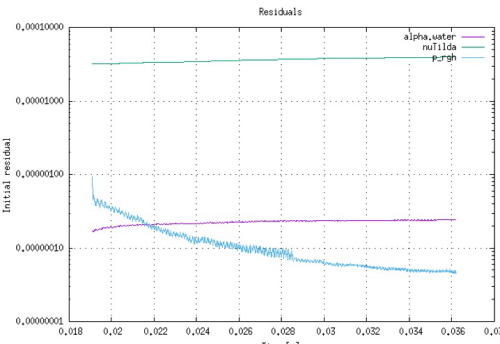
          另外观测压力等物理量的残差如下,这个就比较好理解了:cheeky:

          0_1508035857600_WechatIMG15956.jpeg

          长风破浪会有时,直挂云帆济沧海

          1 Reply Last reply Reply Quote
          • First post
            Last post

          CFD中文网 | 东岳流体 | 京ICP备15017992号-2
          论坛登录问题反馈可联系 li.dy@dyfluid.com