Your browser does not seem to support JavaScript. As a result, your viewing experience will be diminished, and you have been placed in read-only mode.
Please download a browser that supports JavaScript, or enable it if it's disabled (i.e. NoScript).
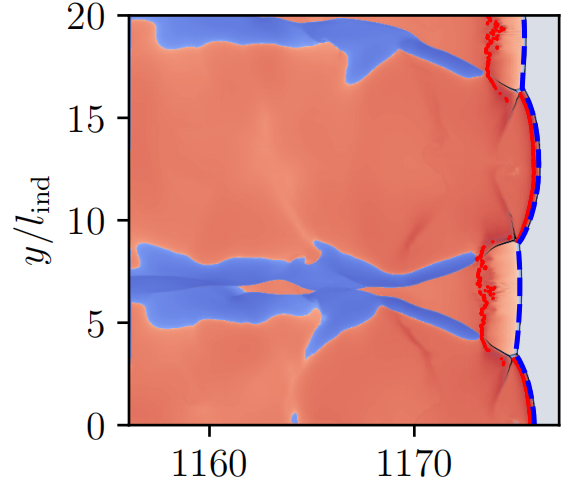
大家晚上好 图中红线对应的是thermicity peak,类似的我想实时获得每个y对应的热释率最大值所在的位置,想问一下有没有大佬有经验呀!